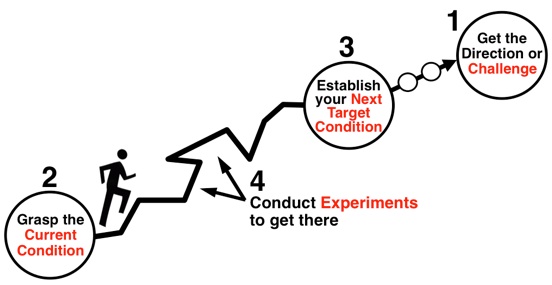
Optimising Software
Delivery with
Value Streams

Joe Schmetzer • @tumbarumba@techhub.social

Introduction

Question One

What is it we do that's valuable?
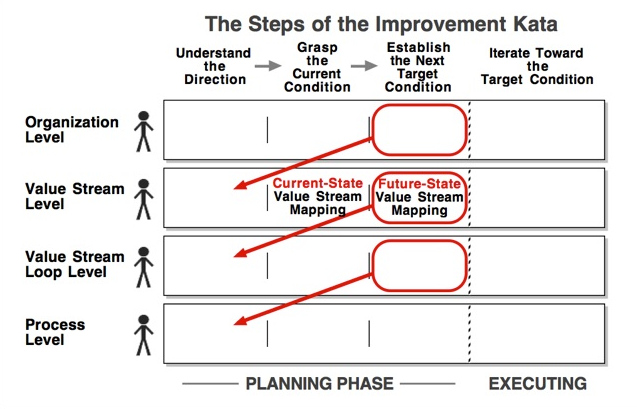
A Value Stream

image/svg+xml

Types of Value Streams

image/svg+xml

Value Stream Tasks

image/svg+xml Value add Overhead Queuing

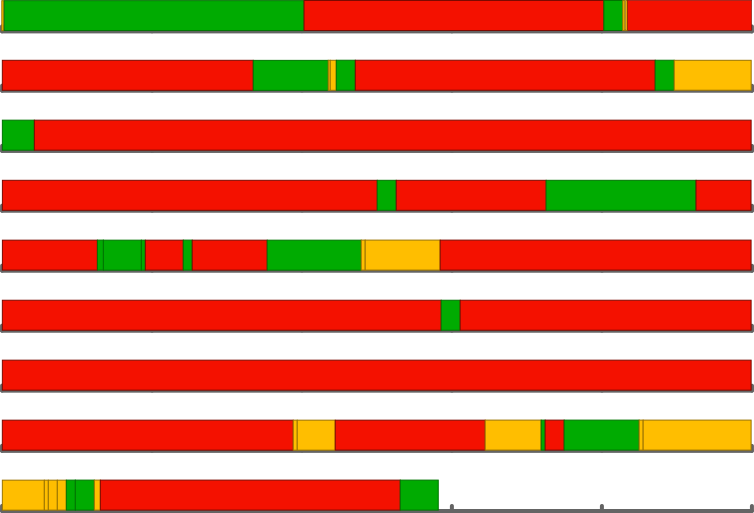
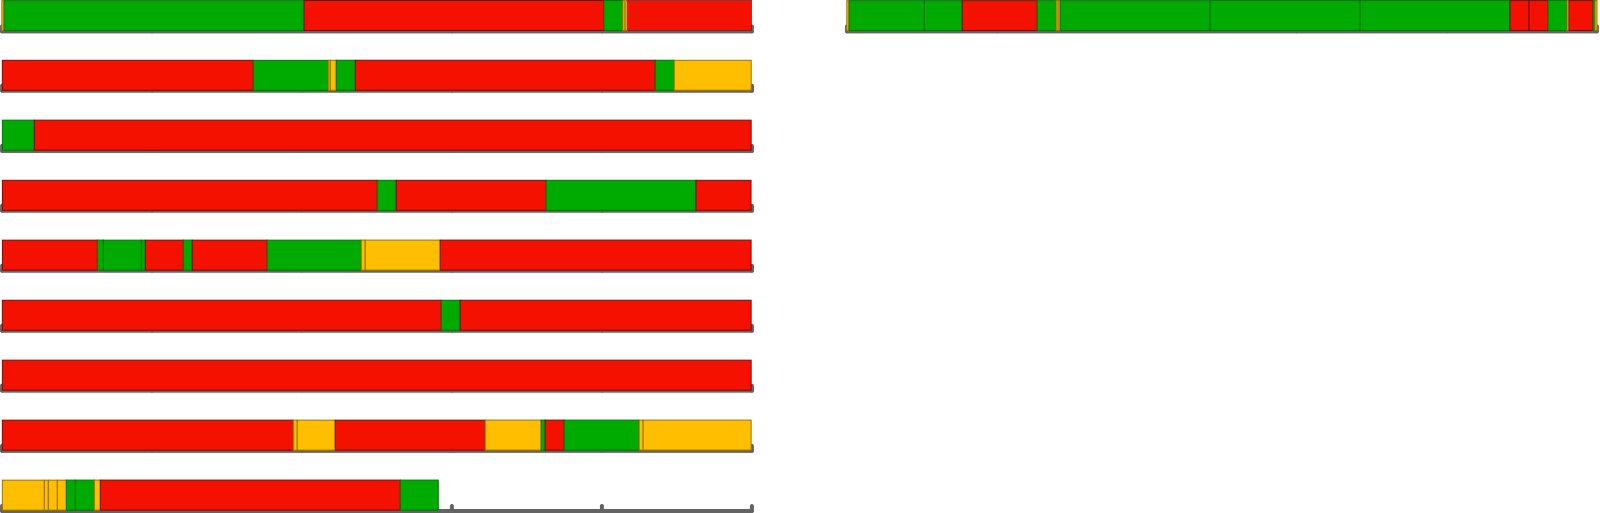
A Value Stream in Detail

image/svg+xml Create design ticket Design work Wait for design review Design review Close design ticket Create analysis ticket Wait for analysis work Analysis work Close analysis ticket Create development ticket Prioritise development ticket Wait for PBR Product backlog review Prepare sprint planning Sprint planning Wait for sprint Wait for refinement Refinement Wait for BA Coding implementation Wait for code review Code review Coding review feedback Create release package for QA Wait for release package to build Deploy to QA Wait for QA team QA test and sign off Record QA defect Coding fix for QA defect Wait for sprint demo Sprint demo Wait for release Branch for release Review check-ins Wait for integration Integration Create release package for regression Wait for regression QA regression test Create regression ticket Coding fix for regression defect Close regression ticket Change approval tickets Chase change approval sign offs Create release runbook Release runbook review Change approval board Wait for release window Release application

Value Stream Statistics

  • 35 different activities
  • 43 days lead time
  • 7 days touch time

Question Two

Why does it take so long?

Single Task Analysis - Data

% Busy Wait Time
0% 0
50% 1
75% 3
90% 9
95% 19
99% 99

Single Task Analysis - Graph

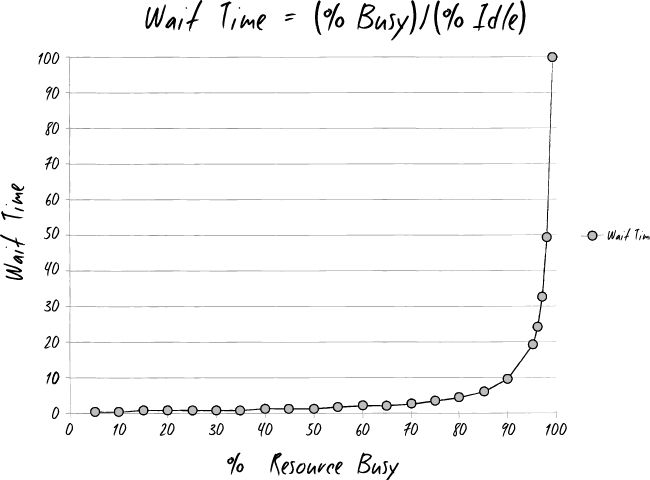
*Graph from the The Phoenix Project, by Gene Kim, Kevin Behr and George Spafford

Little's Law

L = λW

W = L/λ

Linked Queues

Question Three

What alternatives are there?

An Alternative Value Stream

image/svg+xml Create story ticket Research and analysis Draft specification Wait for specification workshop Specification workshop Specification linked to story PO authorises story ticket Design work Automate specification checks Coding implementation Wait for build pipeline Wait for QA Exploratory testing QA sign off Wait for production services Application release Close story ticket

Value Stream Statistics

  • 13 different activities
  • 5 days lead time
  • 4 days touch time

Comparison of Value Streams

Resource Optimisation vs Flow Optimisation

  • 43 days lead time
  • 7 days touch time
  • 5 days lead time
  • 4 days touch time

Product Economic Framework

Standard economic measure:

Life-Cycle Profits

Cost of Delay

What happens to life-cycle profits if release is delayed 7 weeks?

Question Four

How do we change?

Culture

Don't ask for permission to do the right thing

Step 1: Measure

  • Life-cycle profits delivered
  • Lead time
  • Size of backlog
  • Work in progress
  • Velocity
  • ... whatever is relevant to you

Step 2: Visualise the current value stream

Step 3: Plan an updated value stream

Step 4: Small, incremental experiments

Toyota Improvement Kata

*Image from The Improvement Kata, by Mike Rother

Improvement Kata with Value Streams

*Image from Value Stream Mapping, by Mike Rother

References

Joe Schmetzer • @tumbarumba

Next Steps

Let's create our own value stream...